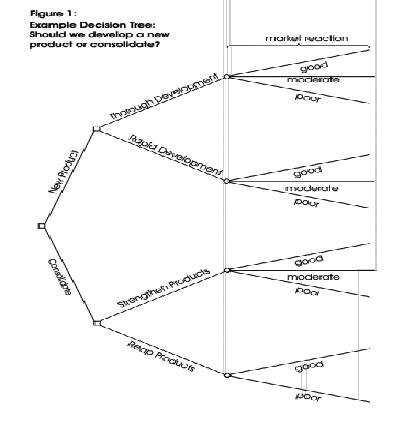
Decision
trees provide an effective method of Decision Making because they:
Clearly
lay out the problem so that all options can be challenged
Allow
us to analyze fully the possible consequences of a decision
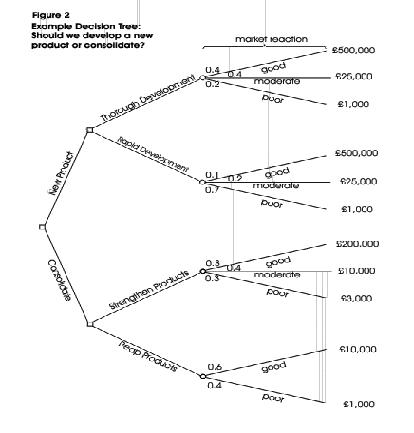
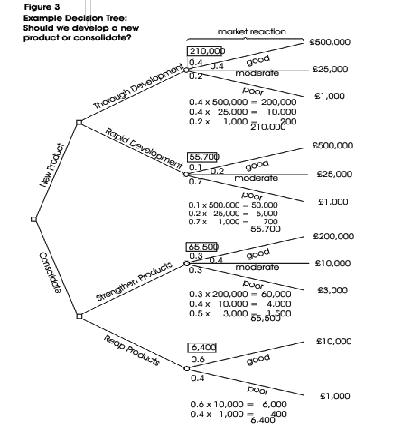
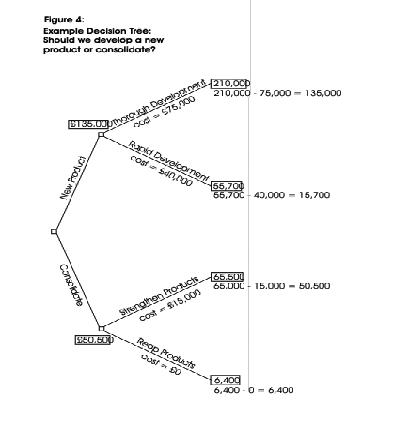
Provide
a framework to quantify the values of outcomes and the probabilities of achieving them
Help
us to make the best decisions on the basis of existing information and best guesses.
As with all Decision Making methods, decision tree analysis should be used in conjunction with common sense - decision
trees are just one important part of your Decision Making tool kit.
Six Thinking Hats
- Looking at a Decision From All Points of View
How
to Use Tool:
'Six
Thinking Hats' is an important and powerful technique. It is used to look at decisions from a number of important perspectives.
This forces you to move outside your habitual thinking style, and helps
you to get a more rounded view of a situation.
This tool was created by Edward de Bono in his book '6 Thinking Hats'.
Many successful people think from a very rational, positive viewpoint. This is part of the reason
that they are successful. Often, though, they may fail to look at a problem from an emotional,
intuitive, creative or negative viewpoint. This can mean that they underestimate resistance to plans, fail
to make creative leaps and do not make essential contingency plans.
Similarly,
pessimists may be excessively defensive, and more emotional people may fail to look at decisions calmly and rationally.
If you look at a problem with the 'Six Thinking Hats'
technique, then you will solve it using all approaches. Your decisions and plans will mix ambition, skill in execution, public sensitivity, creativity and good contingency planning.
How to Use the Tool:
You can use Six Thinking Hats in meetings or on your
own. In meetings it has the benefit of blocking the confrontations that happen when people with different thinking styles discuss the same problem.
Each 'Thinking Hat' is a different style of thinking. These are explained below:
White Hat:
With this thinking hat you focus on the data available.
Look at the information you have, and see what you can learn from it. Look for gaps in your knowledge, and either try to fill them or take account of them.
This is where you analyze past trends, and try to extrapolate from historical data.
Red Hat:
'Wearing' the red hat, you
look at problems using intuition, gut reaction, and emotion. Also try to think how other people will react emotionally. Try to understand the responses of people who do not fully know your reasoning.
Black Hat:
Using black hat thinking, look at all
the bad points of the decision. Look at it cautiously and defensively. Try to see why it might not work. This is important because it highlights the weak points in a plan. It allows you to eliminate them, alter them, or prepare contingency
plans to counter them.
Black Hat thinking helps to make your plans 'tougher' and more resilient. It can also help you to spot fatal flaws
and risks before you embark on a course of action. Black Hat thinking is one of the
real benefits of this technique, as many successful people get so used to thinking positively that often they cannot see problems in advance. This leaves them under-prepared for difficulties.
Yellow Hat:
The yellow hat helps
you to think positively. It is the optimistic viewpoint that helps you to see all the benefits of the decision and the value
in it. Yellow Hat thinking helps you to keep going when everything looks gloomy and difficult.
Green Hat:
The Green Hat stands for creativity.
This is where you can develop creative solutions to a problem. It is a freewheeling way of thinking, in which there is little criticism of ideas. A whole range of creativity tools can help you here.
Blue Hat:
The Blue Hat stands for process control.
This is the hat worn by people chairing meetings. When running into difficulties because ideas are running
dry, they may direct activity into Green Hat thinking. When contingency plans are needed, they will ask for Black Hat thinking,
etc.
A variant
of this technique is to look at problems from the point of view of different professionals (e.g. doctors, architects, sales
directors, etc.) or different customers.
Example:
The
directors of a property company are looking at whether they should construct a new office building. The economy is doing well,
and the amount of vacant office space is reducing sharply. As part of their decision they decide to
use the 6 Thinking Hats technique during a planning meeting.
Looking
at the problem with the White Hat, they analyze the data they have. They examine the trend in vacant office space, which shows
a sharp reduction. They anticipate that by the time the office block would be completed, that there
will be a severe shortage of office space. Current government projections show steady economic
growth for at least the construction period.
With
Red Hat thinking, some of the directors think the proposed building looks quite ugly. While it would be highly cost-effective,
they worry that people would not like to work in it.
When
they think with the Black Hat, they worry that government projections may be wrong. The economy may be about to enter a 'cyclical
downturn', in which case the office building may be empty for a long time. If the building is
not attractive, then companies will choose to work in another better-looking building at the
same rent.
With
the Yellow Hat, however, if the economy holds up and their projections are correct, the company stands to make a great deal
of money. If they are lucky, maybe they could sell the building before the next downturn, or rent to tenants
on long-term leases that will last through any recession.
With Green Hat thinking they consider whether they should change the design to make the building more
pleasant. Perhaps they could build prestige offices that people would want to rent in any economic climate. Alternatively, maybe they
should invest the money in the short term to buy up property at a low cost when a recession comes.
The
Blue Hat has been used by the meeting's Chair to move between the different thinking styles. He or she may have needed to
keep other members of the team from switching styles, or from criticizing other peoples' points.
It
is well worth reading Edward de Bono's book 6 Thinking Hats for more information on this technique.
Key points:
Six
Thinking Hats is a good technique for looking at the effects of a decision from a number of different points of view.
It
allows necessary emotion and skepticism to be brought into what would otherwise be purely rational decisions. It opens up
the opportunity for creativity within Decision Making. The technique also helps, for example,
persistently pessimistic people to be positive and creative.
Plans
developed using the '6 Thinking Hats' technique will be sounder and more resilient than would otherwise be the case. It may
also help you to avoid public relations mistakes, and spot good reasons not to follow a course of action before
you have committed to it.
Cost/Benefit Analysis
- Evaluating Quantitatively Whether to Follow a Course of Action
How to use tool:
You
may have been intensely creative in generating solutions to a problem, and rigorous in your selection of the best one available.
This solution may still not be worth implementing, as you may invest a lot of time and money in solving a
problem that is not worthy of this effort.
Cost/Benefit
Analysis is a relatively* simple and widely used technique for deciding whether to make a change. As its name suggests, to
use the technique simply add up the value of the benefits of a course of action, and subtract the costs
associated with it.
Costs
are either one-off, or may be ongoing. Benefits are most often received over time. We build this effect of time into our analysis
by calculating a payback period. This is the time it takes for the benefits of a change to repay
its costs. Many companies look for payback over a specified period of time - e.g. three
years.
In
its simple form, cost/benefit analysis is carried out using only financial costs and financial benefits. For example, a simple
cost/benefit analysis of a road scheme would measure the cost of building the road, and subtract
this from the economic benefit of improving transport links. It would not measure either
the cost of environmental damage or the benefit of quicker and easier travel to work.